


DevOps Performance Metrics and Engineering Productivity Dashboards
- Marcus Koch

- Apr 27
- 5 min read
Modern software delivery depends on speed, reliability, and continuous improvement. DevOps practices have transformed how teams build, test, and deploy applications, but without clear measurement, even the best processes can drift into inefficiency. This is where DevOps performance metrics and engineering productivity dashboards become critical. They provide visibility into workflows, help identify bottlenecks, and align engineering efforts with business outcomes.
In this article, we explore the most important DevOps metrics, how to design effective dashboards, and how organizations can use data-driven insights to improve team performance and product quality.
Why DevOps Metrics Matter
DevOps is fundamentally about feedback loops. The faster teams can detect issues, measure outcomes, and adapt, the more competitive they become. Metrics serve as the backbone of this feedback system.
At a high level, DevOps metrics help answer key questions:
How quickly can we deliver new features?
How stable and reliable is our system?
Where are the bottlenecks in our pipeline?
How productive are our engineering teams?
Without measurable indicators, teams rely on intuition, which can lead to inconsistent results. Metrics introduce objectivity and allow organizations to track progress over time.
One of the biggest advantages of structured measurement is improved collaboration. When developers, operations engineers, and stakeholders share the same data, alignment improves naturally. This is where IT visualization and reporting for software teams plays a vital role. Clear dashboards make complex data accessible, ensuring that everyone - from engineers to executives—understands performance trends and priorities.
Core DevOps Performance Metrics
While organizations may track dozens of metrics, a few have emerged as industry standards. These are often associated with high-performing DevOps teams and provide a solid foundation for measurement.
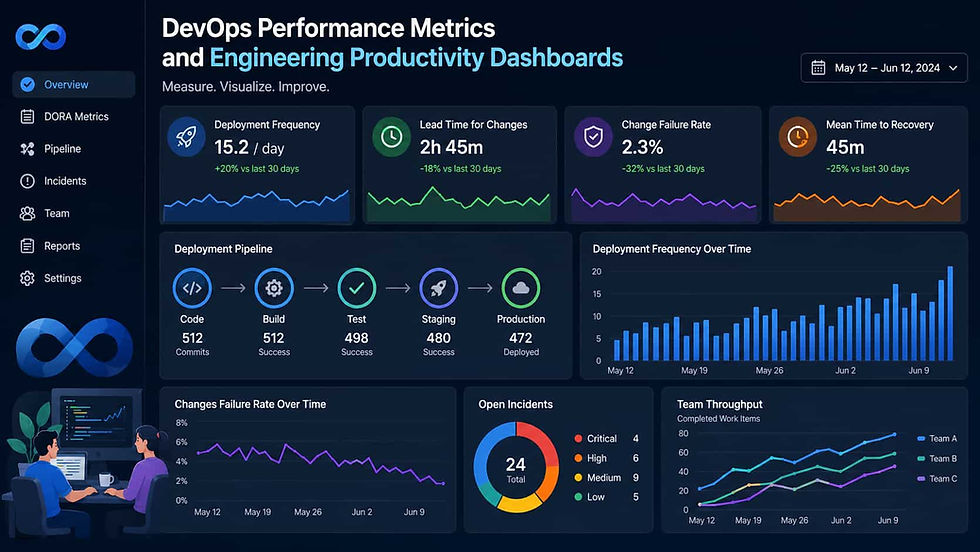
Deployment Frequency
This metric measures how often code is deployed to production. High-performing teams deploy multiple times per day, while less mature teams may deploy weekly or monthly. Frequent deployments indicate a streamlined pipeline and reduced batch sizes, which lower risk.
Lead Time for Changes
Lead time measures the duration from code commit to production deployment. Shorter lead times mean faster delivery of value to users. This metric is especially important for organizations aiming to remain competitive in fast-moving markets.
Change Failure Rate
This metric tracks the percentage of deployments that result in failures, such as bugs, outages, or rollbacks. A low failure rate indicates strong testing practices and stable releases.
Mean Time to Recovery (MTTR)
MTTR measures how quickly a team can recover from a failure. Even with strong processes, failures are inevitable. What distinguishes high-performing teams is their ability to respond and restore services quickly.
Cycle Time and Throughput
Cycle time focuses on how long it takes to complete a unit of work, while throughput measures how much work is completed over a period. Together, they provide insights into team efficiency and workload management.
Infrastructure and Cost Metrics
Modern DevOps environments often rely on cloud infrastructure. Monitoring resource usage, costs, and scalability ensures that systems remain efficient and sustainable.
By focusing on these core metrics, teams can balance speed and stability—two critical dimensions of successful DevOps practices.
Designing Effective Engineering Productivity Dashboards
Metrics alone are not enough. Without proper visualization, data can become overwhelming and difficult to interpret. Engineering productivity dashboards transform raw data into actionable insights.
An effective dashboard should be:
Clear and focused: Avoid clutter and highlight the most important metrics
Real-time or near real-time: Enable quick responses to changes
Role-specific: Tailor views for developers, managers, and executives
Actionable: Provide insights that lead to decisions
A well-designed dashboard often includes:
Pipeline status (build, test, deploy stages)
Incident tracking and alerts
Performance trends over time
Team workload distribution
Visualization techniques such as charts, heatmaps, and trend lines help teams quickly identify anomalies and patterns. For example, a sudden increase in failure rate or a spike in lead time can signal deeper issues in the development process.
Integrating dashboards into daily workflows is equally important. Teams that review metrics during stand-ups or sprint retrospectives are more likely to act on insights and continuously improve.
Connecting DevOps Metrics with Business Outcomes
One of the biggest challenges organizations face is linking engineering metrics to business value. While technical metrics are essential, they must ultimately support broader goals such as customer satisfaction, revenue growth, and market competitiveness.
For example:
Faster deployment frequency can lead to quicker feature releases and improved user engagement
Lower failure rates enhance customer trust and reduce downtime costs
Shorter lead times improve responsiveness to market demands
Organizations should also consider emerging trends such as robotics software development trends for modern IT teams. As robotics and automation become more integrated into software ecosystems, DevOps metrics must evolve to account for hardware-software interactions, real-time data processing, and edge computing performance.
Additionally, regulatory requirements and risk management play an increasingly important role. Metrics related to security and compliance for connected systems help ensure that systems meet industry standards and protect sensitive data, especially in sectors like finance, healthcare, and IoT.
By aligning DevOps metrics with strategic objectives, companies can ensure that engineering efforts directly contribute to business success.
Best Practices for Implementing DevOps Metrics
Successfully implementing DevOps metrics requires more than selecting the right indicators. It involves cultural change, tooling, and continuous refinement.
Start Small and Scale Gradually
Begin with a core set of metrics, such as deployment frequency and lead time. As teams become more comfortable with measurement, expand to additional metrics.
Avoid Vanity Metrics
Not all metrics are equally valuable. Focus on those that drive meaningful improvements rather than those that simply look impressive.
Encourage a Data-Driven Culture
Metrics should empower teams, not punish them. Avoid using metrics for blame. Instead, use them to identify opportunities for improvement and foster collaboration.
Automate Data Collection
Manual tracking is time-consuming and prone to errors. Use tools that automatically collect and visualize data from CI/CD pipelines, monitoring systems, and version control platforms.
Continuously Review and Refine
As systems and processes evolve, so should your metrics. Regularly assess whether your metrics still align with your goals.
Integrate Feedback Loops
Combine quantitative data with qualitative feedback from developers and users. This holistic approach provides a more complete picture of performance.
Conclusion
DevOps performance metrics and engineering productivity dashboards are essential tools for modern software teams. They provide the visibility needed to optimize processes, improve collaboration, and deliver high-quality products at speed.
By focusing on key metrics such as deployment frequency, lead time, and failure rates, organizations can build a strong foundation for continuous improvement. Effective dashboards transform these metrics into actionable insights, enabling teams to make informed decisions and respond quickly to challenges.
Ultimately, the goal is not just to measure performance, but to enhance it. When metrics are aligned with business objectives and supported by a data-driven culture, they become a powerful driver of innovation and success.


